


If you run a busy SQL server an experience performance issues, there are several things you can do to diagnose issues. I’ll ignore the obvious ones for now (ensuring your queries are streamlined and using the SQL Profiler) and will provide you with an additional script to run which will give you a view of the queries running or queued at the time the script is run.
Basic SQL query to find queries running in SQL server
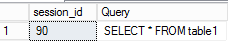
This can be as simple or complex as you want, but to start with, let’s keep it simple and just get a list of the current queries from sys.dm_exec_requests and cross reference sys.dm_exec_sql_text to get the query being run/waiting, as shown below:
SELECT
req.session_id,
sqltext.TEXT As Query
FROM
sys.dm_exec_requests req WITH (nolock)
CROSS APPLY
sys.dm_exec_sql_text(sql_handle) AS sqltext
This will return a view like the below:
![]()
Advanced SQL query to find queries running in SQL server
Now whilst the basic query contains good information, we can do better and get information to help with diagnosing issues. Other information I like to include, is:
- Server from which the query originates.
- Login usernames used.
- Query status.
- If a another query is blocking it.
- Type of query.
- CPU time.
- Total elapsed time.
- Transaction isolation level.
To do this, we’ll just add an additional join to sys.dm_exec_sessions and include some extra columns, as shown below:
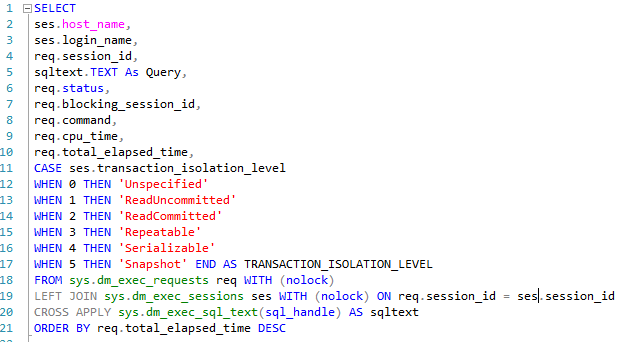
SELECT
ses.host_name,
ses.login_name,
req.session_id,
sqltext.TEXT As Query,
req.status,
req.blocking_session_id,
req.command,
req.cpu_time,
req.total_elapsed_time,
CASE ses.transaction_isolation_level
WHEN 0 THEN 'Unspecified'
WHEN 1 THEN 'ReadUncommitted'
WHEN 2 THEN 'ReadCommitted'
WHEN 3 THEN 'Repeatable'
WHEN 4 THEN 'Serializable'
WHEN 5 THEN 'Snapshot'
END AS TRANSACTION_ISOLATION_LEVEL
FROM
sys.dm_exec_requests req WITH (nolock)
LEFT JOIN
sys.dm_exec_sessions ses WITH (nolock) ON req.session_id = ses.session_id
CROSS APPLY
sys.dm_exec_sql_text(sql_handle) AS sqltext
ORDER BY
req.total_elapsed_time DESC
This will return an output as shown below:
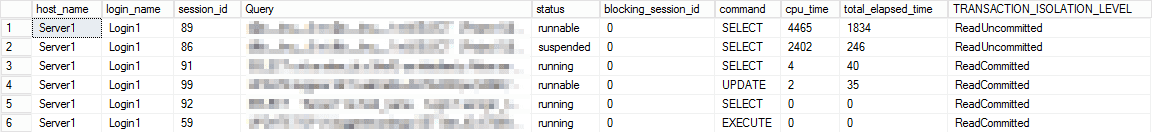
The columns should be self-explanatory and you could expand on this by adding more fields, but these are the ones I find most useful and I choose to order the results by the elapsed time (descending) so I can see the queries with the most impact first.